In our Cloud Product Mapping article, we’ve mapped Monitoring services provided by AWS, Azure and Google Cloud (GCP). We’ll compare these three vendors’ monitoring services with more details in two articles, starting from this one.
Theory
Before we drill into the service comparison, same approach as usual, we’ll take a step back and take a look at the Why, How and What of the cloud monitoring first.
- Why (Strategy and Objectives) – As the starting point, we need to understand the strategy and objectives we need to align, e.g. gaining visibility, identifying issues, optimizing resources, improving operational efficiency, meeting SLA, meeting compliance requirements, etc. Cloud monitoring is not a cost-free nor single-step practice. If we don’t align to the business strategy and objective, the funding for the implementation and operation will become a problem. Rushing into an intermediate solution will also cause rework down the line too
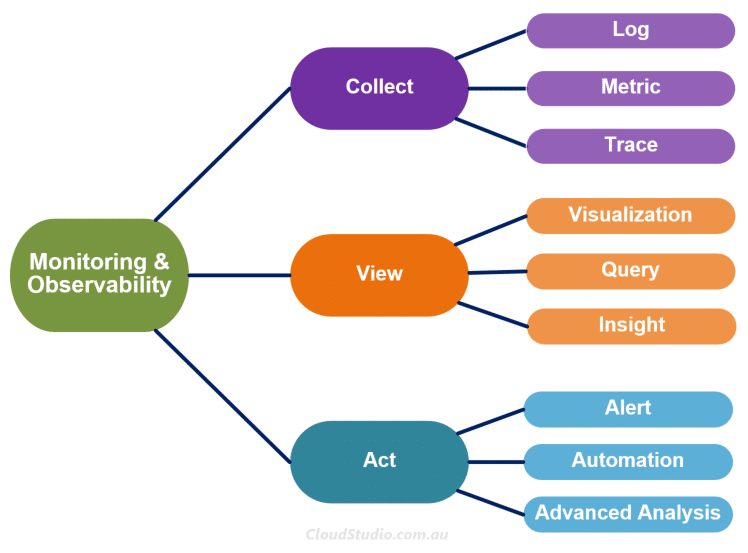
- How (Lifecycle and Tools) – The How here refers to the lifecycle and tools that we use to realise the Why. We can summarise the lifecycle of cloud monitoring as Collect, View and Act. The tools can be either the cloud native monitoring services or the 3rd party monitoring tools, or the combo of them. In this article, we’ll put focus on the cloud native monitoring services from AWS, Azure and GCP.
- What (Targets and Actions) – In addition to the Why and How, it’s also critical to understand what we are monitoring and what actions we should take upon certain event or analysis outcomes. The monitoring targets refer to cloud services and resources, on-prem infrastructure and resources, Applications, etc. The actions refer to alerts, automated remediation and more. We must align the targets and actions to the Why, i.e. the strategy and objectives.
The Why and What are critical but vary per business case. We won’t use too much ink on them here. Instead, we’ll be focusing on the “How” part.
Monitoring and observability sometimes are compared as two different concepts. Our point of view is that these two terms are tightly coupled together. Cloud vendors also have the observability blended in their monitoring services. So we are grouping these two terms together and mapping the lifecycle accordingly (as shown below). We’ll compare AWS, Azure and GCP’s monitoring services starting from the Collect stage in the following sections.

In the Collect stage, there are three key inputs, i.e. Log, Metric and Trace. The typical three pillars of the observability. To understand the differences between these three types of inputs, we can again borrow our “car analogy”. Let’s say Richard filled petrol for his car at a petrol station on Monday morning. For this event, the log is like “Richard paid $10 to fill 5 litres of petrol for his car at 6am on Monday”; a metric is like “5 litres of petrol filled at 6pm”. For this event, it presented a state – the state of a car having petrol filled. The key concern here is how much petrol has been filled. While the log captures the comprehensive information of this event, the metric records just enough information to cover the key concern and it’s lightweight.
What about the trace in this case? Well let’s take a look at another event. Richard was late for work on Monday. Let’s keep looking. Richard’s car ran out of petrol and conked out on the way to work. When we join these three events together, it’s not hard to find out that the root cause of the late-for-work issue is Richard didn’t fill enough petrol (let’s ignore Richard’s complaining about the petrol price here). But if the logs of these events are stored separately in the petrol station, the roadside assist system and the office check-in system, it’ll take a bit effort to find out the root cause. But if we capture the whole end-2-end travel information and store it in one place, it’ll be much easier to track back. By doing so, we are creating a trace.
With the data from these three inputs, we’ll be able to tell the full story and know what actions we should take next. Now let’s relate this analogy back to how AWS, Azure and GCP collect these inputs.
Collect in AWS
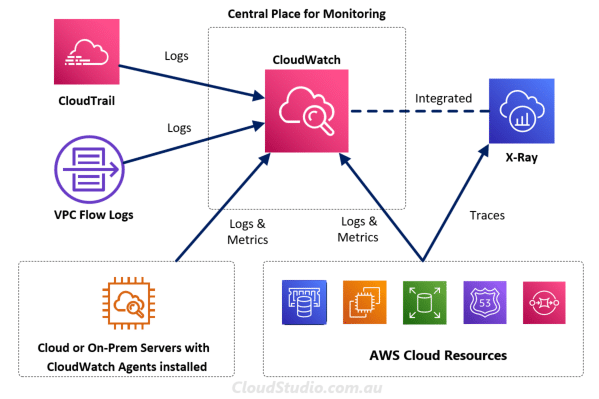
Let’s start with AWS first. AWS has different services that collect logs, metrics and traces. It includes CloudWatch, CloudTrail, VPC Flow Logs and X-Ray. Initially, it may seem to be a bit confusing by looking at all these separate services instead of an all-in-one type of service, isn’t it. Let’s use the diagram below to do a high-level mapping on what type of data these services collect and how these services relate to each other.

CloudTrail is a service that collects event logs that record actions taken by users, roles and services. And these actions can be taken from AWS console, CLI SDK and APIs. However, it doesn’t capture information about IP traffic that goes through network interfaces within VPCs. So AWS provides a feature under the VPC services called VPC Flow Logs. As its name, it captures the VPC flow logs that provides additional log data to support the network monitoring. Both Cloud Trail and VPC Flow Logs can publish their log data to CloudWatch.
CloudWatch is like a central monitoring service. It collects metrics and logs from AWS services. Note that AWS services only send metrics to CloudWatch when we are using these services. We also need to be aware that not every AWS service is capable of sending metrics to CloudWatch. We can find out which ones can publish metrics and which ones can’t from AWS services that publish CloudWatch metrics.
If we want to collect additional metric and log data from AWS hosted and/or on-prem servers, we can install the CloudWatch agent in those servers. More information about the agent installation are available at Installing and running the CloudWatch agent on your servers. The agent, CloudTrail, VPC Flow Logs and enabled AWS native services all send their log and metric data to CloudWatch. It makes the CloudWatch the central repository for metrics and logs, which enables the subsequent views and actions.
X-Ray as a separate service traces user requests as they travel through the entire application. It doesn’t forward trace data to CloudWatch. But AWS has now integrated X-Ray with CloudWatch so that users can view logs, metrics and traces in one place.
Collect in Azure
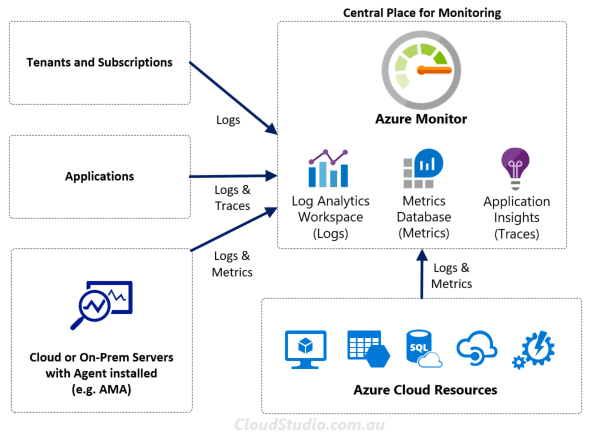
A bit different from AWS, Azure provides an all-in-one service for monitoring, which is Azure Monitor. It collects metrics, logs and traces from various source places, as shown below.

Azure Monitor automatically collects metrics and stores them in the metrics database behind the sense. Logs on the other hand is not collected automatically. Users need to create at least one Log Analytics workspace, and then configure the sources to send the logs to it. Similar to AWS, Azure originally had Azure Monitor, Log Analytics and Application Insights as separate services. They consolidated these services into one back in 2018. They’ve also provided a reference article with the complete list of data sources that users can configure to send logs to Azure Monitor. The list available at What can you monitor. This consolidation provides much better user experience and reduces the confusion on where to find things.
Talking about confusion, Azure has a number of different monitoring agents due to historical reason. It brings another gap for Azure to fill. Luckily they’ve realized the problem and started to mitigate it by introducing an all-in-one agent, called Azure Monitor Agent (AMA). It’s still marching through its journey of consolidation. Hopefully we’ll soon just need to use a single agent (i.e. AMA) when we want to set up the agent-based configurations.
For traces, Azure uses the Transaction Diagnostics and Application Map to cover the distributed tracing. Both are features under the Application Insight. To enable the distributed tracing, we need to install the Application Insight Agent or Application Insight SDK first. Once enabled, Azure will store the trace data together with the other log data. When we want to view or query the trace data, we can do so by drilling into the Logs blade within the Application Insight console. The detailed instruction is available at How to view logs and metrics in Application Insights.
Collect in GCP
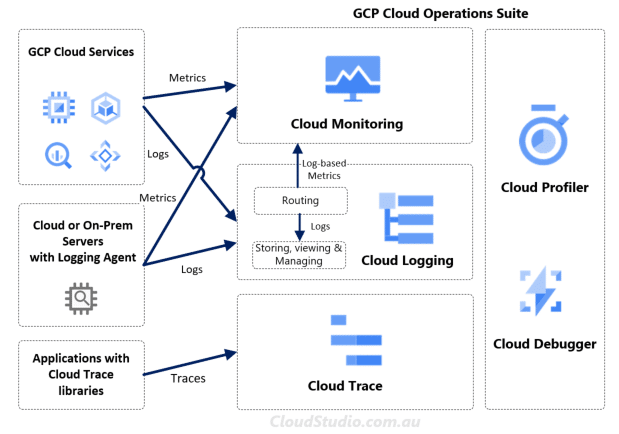
Like AWS and Azure’s consolidation approach, GCP also consolidates monitoring related services into one service suite, called Cloud Operations Suite (used to be called Stackdriver). It contains Cloud Monitoring, Cloud Logging, Cloud Trace, Cloud Profiler and Cloud Debugger.

By just looking at the service names, it’s pretty easy to map them to the three observability pillars. For log data, GCP grouped them into different categories, i.e. Platform Logs, User-written Logs, Component Logs, Security Logs, Multi-cloud and Hybrid-cloud Logs. The Cloud Logging service receives, indexes and stores these log data. It can route log-based metrics to Cloud Monitoring as well. GCP has documented the details of the log types and log routing in Available Logs and Routing and Storage Overview.
From the metric aspect, GCP also grouped metrics into different categories. We can summarise them as Google Cloud Metrics, Agent Metrics and External Metrics. These three categories cover over 1500 types of metrics across more than 100 GCP cloud services/resources. The details are available at Metric List and Monitored Resource List.
Last but not least, the Cloud Trace. It’s like AWS’s X-Ray and Azure’s Application Insight. The core of these services is enabling the distributed tracing. We’ll talk more about the distributed tracing in a separate article in the future as it’s a big topic just by itself. For GCP’s Cloud Trace, the details are available at About Cloud Trace. For Cloud Profiler and Cloud Debugger, they are more relevant to the View and Act instead of Collect. We’ll go through them in our part 2 article.
To Be Continued
Cloud monitoring is a big topic, so instead of creating a “monolithic” article, we’ll disassemble it into “micro” articles. In this part 1 article, we’ve covered the high-level view on Why, How and What and the lifecycle mapping as well as the way AWS, Azure and GCP collect the monitoring data. In the Part 2 article, we’ll cover the View, Act and Cost parts. Stay tuned.


Excellent collection, Thanks
Excellent breif4. I would like to receive the Blog this kind of information
Thanks Mabohar, you can use https://cloudstudio.com.au/feed/ to subscribe for new article updates.
Hello,
Strayer University is seeking permission to make the following material available electronically to learners in an online course. We would like to link to your Web page:
1. Monitoring Service Comparison – AWS vs Azure vs GCP (Part 1)
2. Monitoring Service Comparison – AWS vs Azure vs GCP (Part 2)
Web page retrieved from:
1. https://cloudstudio.com.au/2022/05/14/monitoring-service-aws-azure-gcp-part1/#Collect
2. https://cloudstudio.com.au/2022/05/28/monitoring-service-aws-azure-gcp-part2/
The citation and link would be listed as resources in Strayer’s online courseroom(s). Access to these materials would be restricted by password to registered learners only.
Strayer University is a for-profit institution. Learners pay tuition to access the course, but would not pay an extra fee to link out to your material. Please consider granting permission for Strayer University to use this material, as described above.
If you need additional information or if there are any limitations placed on our use, please let me know.
Thank you!
Regards,
Atisayopma
Strayer Library
Strayer University Shield Logo
coursewebpermissions@strayer.edu
1133 15th St NW Ste 200, Washington, DC 20005
Strayer.edu