In our Cloud Monitoring Service Comparison Part 1 article, we’ve covered the high-level concept of cloud monitoring and observability as well as how AWS, Azure and GCP collect the monitoring data. In this article, we’ll go through the remaining parts, including View, Act and Cost comparison among these three Cloud Service Providers (CSP).
View
Once we have the monitoring data collected, the next step is View. As shown in the Theory section of the previous article, the View here covers Visualization, Query and Insight.
It may seem to be a bit overlapping between the Insight and the other two. We can consider Insight as a packaged feature with pre-built visualization and queries. For people who are not familiar with creating visualization dashboard or editing queries, Insight provides an OOTB and tailored monitoring UI for applications and cloud services. Now let’s see what services and features AWS, Azure and GCP provide to support these View related practices.
AWS
AWS CloudWatch
Visualization
- Dashboard
- Logs
- Logs Insights
- Metric
- Explorer
- X-Ray
- Service Map
- Application Monitoring
- ServiceLens Map
- Resource Health
- Synthetics Canaries
- Evidently
- RUM
Query
- Logs
- Logs Insight
- Log Groups
Insight
Azure
Azure Monitor
Visualization
Query
Insight
GCP
Operations Suite
Visualization
- Monitoring
- Dashboard
- Metrics Explorer
- Managed Prometheus
- Logging
- Logs Dashboard
- Logs Explorer
- Trace
- Overview
- Trace List
- Analysis Report
- Profiler
Query
- Monitoring
- Metrics Explorer (MQL)
- Managed Prometheus (PromQL)
- Logging
- Logs Explorer (LQL?)
- Log-based Metrics
Insight
- Monitoring
- Services
Note that you can click on the bold items to go to the official documentation sites.
All three CSPs provide decent visualization features in their monitoring services, e.g. dashboard and explorers as shown above. The features listed under Azure Monitor’s visualization section seems to be a bit lightweight comparing with AWS CloudWatch and GCP Operations Suite. On the other hand, Azure Monitor has packaged more Insight features. And it also has another good card in its pocket (or we should say in its parent Microsoft’s pocket), which is Power BI.
From the query aspect, AWS Log Insights provides a built-in query language that allows users to query log groups. Azure also provides a query language with a branded name, called Kusto Query Language (KQL). Coming to GCP, it’s a bit complicated.
Remember in our part 1 article, we talked about GCP stores log data in Cloud Logging and metric data in Cloud Monitoring. It clearly draws a line between where logs and metrics are stored. But this “line” brings in confusion when it comes to the query part. Users need to use different query languages to filter and analyse their monitoring data, i.e. using Logging query language to query logs, and using Monitoring Query Language (MQL) to query metrics. Adding Prometheus’s query language (PromQL) to the picture, we’re having three different query languages. Hopefully GCP will do something to improve it.
From the Insight aspect, as we mentioned earlier, Azure is leading in this area by providing the most insight features. AWS and GCP are also expanding their Insight list at the same time. Among these CSPs’ insight features, some are packaged and tailored based on their proprietary services. It makes these insights unique features and noncomparative, e.g. AWS Lambda Insight and Azure Cosmo DB Insight.
AWS, Azure and GCP have provided decent view related features and the lists are still growing. But for a complete monitoring solution, it’s not the end of the story. Let’s take a look at the Act stage next.
Alert
Coming to the third stage, the Act stage. We can group actions into three A’s, i.e. Alert, Automation and Advanced Analysis.
Let’s start with Alert first. Alert in a nutshell is a message delivery between publishers and subscribers. From the subscriber side, it can be either a person, i.e. application-to-person (A2P) or an application, i.e. application-to-application (A2A). The A2P is more like a heads-up alert/notification to individuals or user groups. The subsequent actions rely on users’ manual follow-up. On the other hand, the A2A will relay the alerts to another application/platform for further actions. The further actions can be either automated or manual, depends on the setup of the application side. AWS, Azure and GCP support both types. The variation is on the publisher side, as shown below.
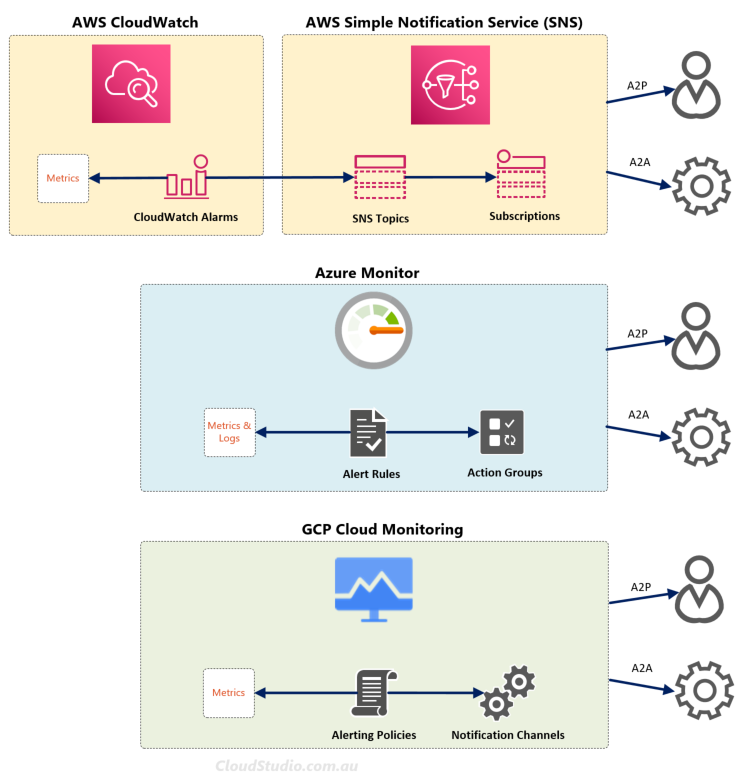
As shown in the diagram above, AWS has decoupled the notification service (i.e. SNS) from CloudWatch. Azure and GCP have the alert functions all built within their monitoring services. Both ways achieve the same alert streaming purpose. From the user experience aspect, the all-in-one approach makes it easier for alert configurations. From the event-driven architecture aspect, AWS’s decoupled way provides a more consistent approach from the data streaming aspect. We’ll talk more about it in the next section.
Automation & Advanced Analysis
Now let’s take a look at the Automation and Advanced Analysis. Some people may argue why don’t we have “integration” also listed under the Act group? The reason being is that we consider integration as the enabler for actions rather than an action itself. When we talk about automations and advanced analysis, it’s already indicating there are integrations behind the scenes.
AWS, Azure and GCP all support a wide range of integrations enabling automations and further analysis. If we look at what’s behind these integrations, it’s about passing the monitoring data between the data source and destinations. As we covered in the Collect section of the Part 1 article, the monitoring data refers to logs, metrics and traces. AWS, Azure and GCP’s monitoring services collect these monitoring data from internal and external resources. They then become the central repository (for short-term) for the monitoring data. Through integrations, we can pass these data to another internal or external service/application for further actions. Let’s take a look at these integrations from the pull vs push angle.
From the pull aspect, we can either call the cloud monitoring service’s API to get the monitoring data, or retrieve them from a long-term storage. It’s commonly used by external applications/platforms. It works fine when we want to conduct further analysis (e.g. filtering and aggregation) on the retrieved monitoring data. However, the pulling mechanism comes with latencies. It will impact certain types of actions, such as automations. For example, if we want to build a monitoring solution with real-time detection and automated remediation, the pull-based integration will not meet the needs due to the latencies. And this is where push-based integration comes to play.
We usually consider pushing monitoring data as a streaming process. AWS’s CloudWatch, Azure’s Monitor and GCP’s Operations Suite can integrate with their own streaming services to stream the monitoring data to the desired destinations. The streaming services are like AWS’s Kinesis, Azure’s Event Hub and GCP’s Cloud Pub/Sub. These are fully-managed services. We can also use serverless functions, like AWS Lambda, Azure Function and GCP Cloud Run, to build custom data pipelines as well.
The streaming-based integrations not only address the latency issue, they also provide benefits like event-driven, high scalability and efficiency. These benefits enable and favourite the automation type of actions. On the other hand, with additional services involved in the integration, it does introduce a different cost structure, but not necessarily more expensive. We’ll take a look at the costing part next.
Cost
Service cost is an important factor for CSP selection and architectural design. For the same service, the unit costs vary per service type and region. CSPs will also adjust their pricing over time. So we won’t compare the dollar amount in this section. Instead, we’ll take a look at what’s free and what’s not from these cloud monitoring services.
AWS CloudWatch offers two categories of monitoring, basic monitoring and detailed monitoring. At the same time, they also group CloudWatch features into free tier and paid tier. It may lead people to think that “free tier” equals “basic monitoring”. The basic and detailed monitoring actually only refer to the metrics related monitoring. We can consider the basic monitoring as part of the free tier. And the free tier has more to offer than just the basic monitoring. The breakdown of the free tier is available in the Free tier section of the CloudWatch pricing site.
On the other hand, the paid tier also comes with a long list of functions and features that will incur costs. Given AWS is building CloudWatch as a one-stop shop for monitoring, it’s not surprised to see this long list in the paid tier due to the number of features involved. However, it becomes a pain point for users to understand the bill and how to optimise the cost. To ease this pain, AWS has provided an article talking about how to understand and reduce CloudWatch charges, we won’t repeat them here.
Similar to AWS’s free tier, Azure Monitor also provides certain level of free units. Like AWS’s basic monitoring, Azure’s Standard Metrics are free too. Azure hasn’t summarised the free-tier features and functions in one place like AWS. Instead, the free-tier information are embedded in the pricing table, i.e. in the “Free unit included” column. For details of the pricing information, see Azure Monitor Pricing. Azure also provides a cost management guidance. It’s available at Azure Monitor best practices – Cost management.
Last but not least, let’s take a look at the pricing for GCP’s Operation Suite, starting from the free part. They don’t have a dedicated free-tier summary either. But in their Pricing FAQ, they summarised it in a way, as below:
Usage of Google Cloud’s operations suite products is priced by data volume. Other than the data volume costs described on this page, usage of all additional Google Cloud’s operations suite product features is free.
The “on this page” here refers to Google Cloud’s Operations Suite Pricing. In addition to this free-tier statement, there is a “Free allotment per month” concept (similar to Azure’s “Free Unit”) as well. The free allotment information are embedded in the pricing table on the referenced pricing page.
Please note that the service costs we talked above may not be the only costs for your monitoring solution. As we discussed earlier in the Automation & Advanced Analysis section, when there are other internal and external services involved in the overall monitoring solution, it’ll incur additional costs. It’s essential to do a thorough cost analysis before implementing a cloud monitoring solution.
Summary
Cloud monitoring is a big topic. We covered the high-level overview and data collection in our part 1 article. And we covered the rest parts including View, Act and Cost in this article. Even we split our content into two articles, we still only touched the basic level of AWS, Azure and GCP’s monitoring services. If these articles have shed some lights on your cloud monitoring related questions, that’s great. If they’ve triggered more questions, that’s even better. It’s better to get to the bottom of the monitoring solution upfront, instead of getting caught in security, structure, operation or cost down the track.


